
David McMillan
Crypto-enthusiast who explores all the possibilities the blockchain technology suggests
What is Bart Simpson Pattern and How to Use It in Trading
Table of Contents
Everybody knows who Bart Simpson is, given the worldwide popularity of “The Simpsons”. But have you ever heard of him in the context of crypto charts? In this article we'll talk about the trading pattern named after this character and all the details you need to know about it.
What is a Bart Pattern?
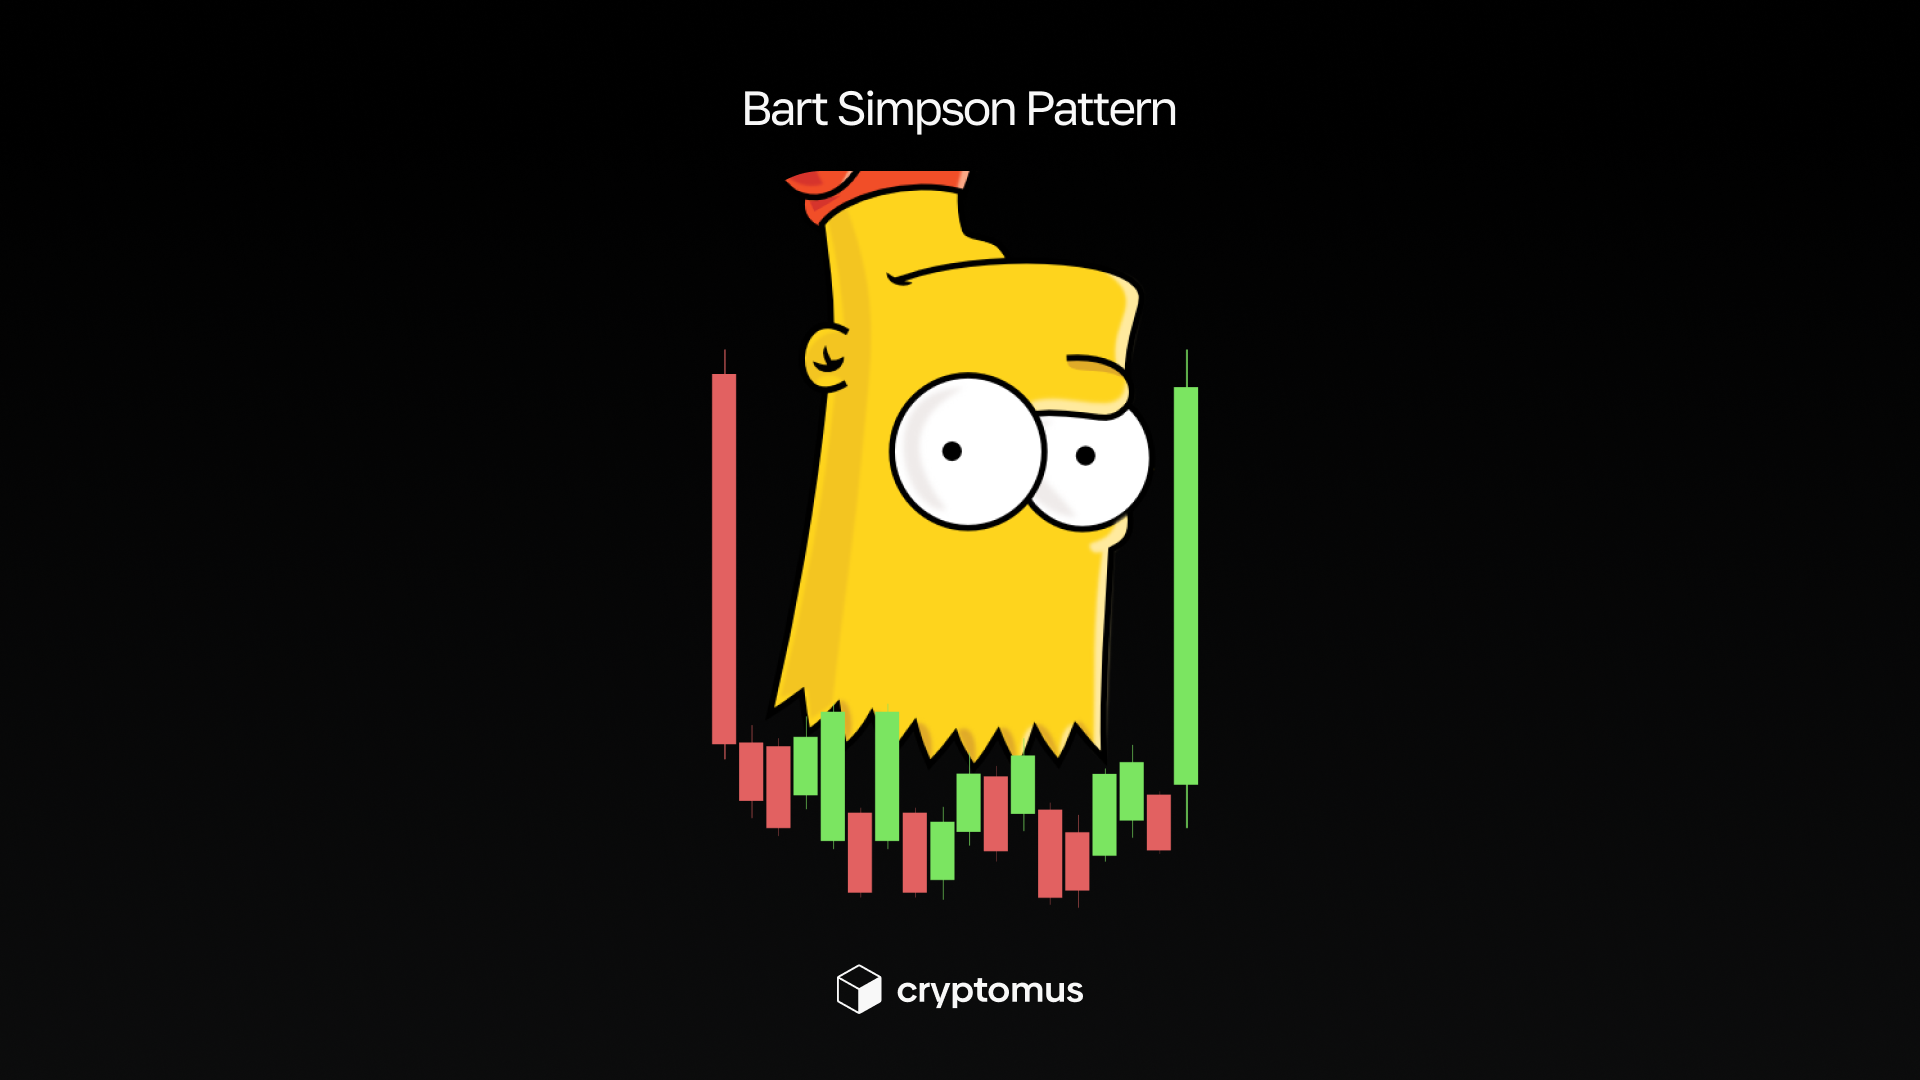
The Bart Simpson pattern is a price movement pattern on a chart in which the price first rises sharply and almost vertically, then moves horizontally in a narrow sideways range for some time, and then falls back sharply to its original level. As a result, the chart resembles the silhouette of Bart Simpson's head with his “spiky” hairstyle.
This pattern is often found in crypto markets and usually indicates manipulation by large players or a lack of real momentum to continue the trend. Traders use it to find possible entry points for short positions after a sideways consolidation phase.

How to Identify this Pattern?
The Bart Simpson pattern is one of the most recognizable crypto charts formations. To identify it, traders need to understand the structure of price movements and the sequence of phases that comprise it. Below are the key elements to look for when analyzing a chart.
- Sharp vertical impulse
The first stage of pattern formation is a rapid and almost vertical upward surge in price. This movement occurs over a short period of time and is often accompanied by an increase in trading volume. This impulse creates the very “jagged” top that is associated with Bart Simpson's hairstyle. Notably, such sudden spikes often occur without any clear fundamental catalyst or news background, making the movement seem abrupt and unjustified from a traditional market perspective.
- Narrow phase of sideways consolidation
After a sharp rise, the market usually “freezes.” The price enters a horizontal corridor characterized by low volatility and small candles. This section resembles the flat top of Bart's head and is a key feature of the pattern. At this point, trading volumes often decline, reflecting a lack of significant interest from market participants.
- Symmetrical sharp decline
The pattern ends with a sharp downward pullback—almost as fast as the previous rise. The price returns to its initial level, where the first impulse began. Thus, the chart forms a characteristic symmetry: a vertical rise, a horizontal “shelf,” and a reverse vertical fall.
There is also a reverse Bart pattern—a mirror version of the classic one—in which the price first falls sharply, almost vertically, then enters a narrow sideways range with low volatility, and then rises just as rapidly back to its original level. This structure indicates a sharp stop-out and liquidity accumulation at the bottom, after which the market returns to its previous prices. The reverse Bart is often found in manipulated or illiquid markets and is often used by traders as a signal for a potential upward reversal.
How to Use Bart Pattern in Trading?
The Bart pattern can be a valuable tool for traders, as it reflects manipulative price movements and allows them to predict sharp reversals in advance. Practical use of the pattern is based on three key stages: observing momentum, analyzing sideways consolidation, and waiting for the final reversal. Below, we will look at how to apply each stage in a trading strategy.
- Determining the moment of pattern formation
In order to recognize and use the pattern in time, it is important for a trader to notice the first signs of its appearance. At this stage, you need to pay attention to:
-
a sharp vertical impulse up or down; an abnormal surge in volume that is not supported by news;
-
a rapid attenuation of movement and a transition to a narrow range.
At this stage, it is too early to enter a trade — the market may still continue the trend.
- Analysis of the horizontal range
The sideways consolidation phase is a key element of the Bart pattern. At this point, the trader observes:
-
a narrowing of the amplitude of fluctuations and a decrease in volatility;
-
the absence of obvious pressure from either buyers or sellers;
-
a gradual decline in volume, which often indicates that the market is preparing for a reversal.
It is at this point that the trader prepares for a potential entry but waits for confirmation.

- Entering a trade after a breakout
Once the price breaks out of the flat, the third phase begins—a sharp return to the initial level. Here, traders use specific entry rules:
For classic Bart:
-
a short position is considered;
-
entry after breaking through the lower boundary of the sideways movement downwards;
-
stop loss slightly above the flat;
-
target—return to the level where the impulse began.
For reverse Bart:
-
a long position is considered; entry after breaking through the upper boundary of the range;
-
stop loss below the lower boundary of the flat;
-
target—return of the price to the level where the decline began.

Using the Bart pattern gives traders an important advantage: it helps them recognize manipulative price movements in advance and predict rapid reversals, allowing them to enter the market at the most profitable points. Thanks to the clear structure of the pattern, traders can open trades with a clear stop-loss level and a predetermined target, which reduces risks and increases the accuracy of trading decisions. In essence, this pattern allows you to turn chaotic, sharp market impulses into predictable and controllable opportunities for profit.
Pros And Cons of the Bart Pattern
For your comfort we've created a table describing most vital advantages and disadvantages of the Bart Pattern
| Pros | Cons | |
|---|---|---|
| Allows you to identify possible price reversals in advance. | False signals may occur during high volatility. | |
| Provides clear entry points and precise stop-loss levels. | Subjective determination: not always easy to distinguish from a normal flat. | |
| Helps to recognize manipulation by large players. | Does not work well in trending markets without sharp impulses. | |
| Suitable for short-term strategies and scalping. | Requires quick decisions and reactions from the trader. | |
| Works well with volumes and levels for confirmation. | In illiquid markets, it can lead to “sawing” and chaotic movements. |
What do you think of this pattern? Have you ever used it to play on the market? How did it go? Let's share our experiences below!


Simplify Your Crypto Journey
Want to store, send, accept, stake, or trade cryptocurrencies? With Cryptomus it's all possible — sign up and manage your cryptocurrency funds with our handy tools.
Get Started